Monthly Archives: December 2012

Few interesting new features in SAS 9.3 – Macro Language

Automatic Macro Variable SYSNOBS: Contains the number of observations read from the last data set that was closed by the previous procedure or DATA step.
Macro Function %SYSMACEXIST: Indicates whether there is a macro definition exist in the WORK.SASMACR catalog.
Macro Statement %SYSMACDELETE: Deletes a macro definition from the WORK.SASMACR catalog.
Till SAS 9.2, the alternate code what we used to write is:
proc catalog catalog=work.sasmacr;
delete helloworld.macro;
quit;

More macro debugging with MAUTOCOMPLOC System option: Displays in the SAS log the source location of the autocall macros when the autocall macro is compiled.
 

SAS Overview

SAS Introduction by its CEO & Founder Jim Goodnight. Watch this video by clicking on the post header or below link @ http://www.youtube.com/watch?v=ksp8CzIgb-E

Power of SAS

Whts the Power of SAS?
Quick video introduction abt SAS. Click on the post title or below link @ http://www.youtube.com/watch?v=PoPOfKb32hM

Subsetting IF and Nth highest salary using Proc SQL

1. Subsetting IF statement without any condition:
(Visitor Contribution:)
data one;
input age;
if age;
cards;
23
12
.
45
0
54
-21
43
;
run;

Output Dataset created:
age
23
12
45
54
-21
43

Conclusion: So, use above IF statement only for FLAG variables which contains values as 0 or 1 (or) . or 1
to have lesser confusion. I mean use it only when you are sure about the data!

2. Extract Nth highest salary from SALARY table using Proc SQL:
data salary;
input sal;
cards;
23
12
.
45
0
54
-21
43
;
run;

%let N=3;
proc sql;
select a.sal from salary a where &N= (select count(distinct sal) from salary b where a.sal<=b.sal);
quit;


Delete Observations based on missing values

1. To delete an observation if all the variables (both Num & char) having missing values, use the below logic:
Data Non_miss;
Set All;
if missing(coalesce(of _numeric_)) and missing(coalescec(of _character_)) then delete;
Run;
MISSING Function: Returns a numeric result that indicates whether the argument contains a missing value
COALESCE Function: Returns the first non-missing value from a list of numeric arguments.
COALESCEC Function: Returns the first non-missing value from a list of character arguments.

2. To delete an observation if selected numeric variables having missing values, use below logic:
if n(var1, var2, var3, var4)=0 then delete;
N Function: Returns the number of nonmissing values

Interview questions

Interview questions.

SAS KNOWLEDGE

The Structure of OLAP Cubes:

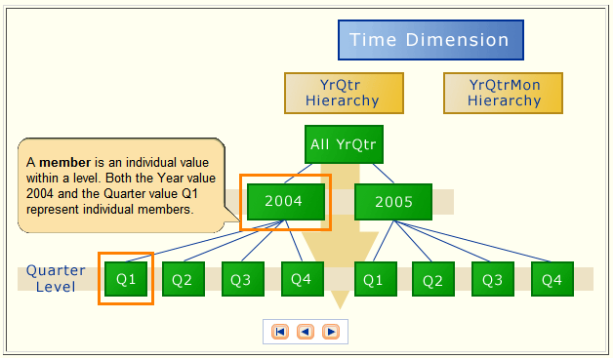
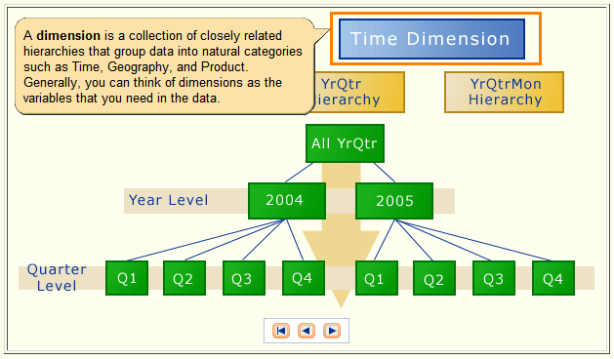
A cube is a set of data that is structured hierarchically. Unlike relational databases that use two-dimensional data structures (often in the form of columns and rows in a spreadsheet), cubes are logical, multidimensional models that consist of the following elements:
* one or more dimensions
* one or more levels
* one or more hierarchies
* members
If you’re not familiar with the structure and elements of OLAP cubes, you can go through the following series of pictures.


View original post

The Structure of OLAP Cubes

The Structure of OLAP Cubes:

A cube is a set of data that is structured hierarchically. Unlike relational databases that use two-dimensional data structures (often in the form of columns and rows in a spreadsheet), cubes are logical, multidimensional models that consist of the following elements:
* one or more dimensions
* one or more levels
* one or more hierarchies
* members
If you’re not familiar with the structure and elements of OLAP cubes, you can go through the following series of pictures.


Change from Baseline Calculation : Clinical SAS

Change-from-Baseline:
The purpose of using change-from-baseline analysis data sets is to measure what effect some therapeutic intervention had on some kind of diagnostic measure. A measure is taken before and after therapy, and a difference and sometimes a percentage difference are calculated for each post-baseline measure. These data sets are generally normalized vertical structure data sets. Here is an example of how such a data set could be created for systolic and diastolic blood pressure data.

data bp;
input subject $ week test $ value;
datalines;
101 0 DBP 160
101 0 SBP 90
101 1 DBP 140
101 1 SBP 87
101 2 DBP 130
101 2 SBP 85
101 3 DBP 120
101 3 SBP 80
202 0 DBP 141
202 0 SBP 75
202 1 DBP 161
202 1 SBP 80
202 2 DBP 171
202 2 SBP 85
202 3 DBP 181
202 3 SBP 90
;
run;

**** SORT DATA BY SUBJECT, TEST NAME, AND WEEK;
proc sort data = bp;
by subject test week;
run;
**** CALCULATE CHANGE FROM BASELINE SBP AND DBP VALUES.;
data bp;
set bp;
by subject test week;
**** CARRY FORWARD BASELINE RESULTS.;
retain baseline;
if first.test then baseline = .;
**** DETERMINE BASELINE OR CALCULATE CHANGES.;
if visit = 0 then baseline = value;
else if visit > 0 then
do;
change = value – baseline;
pct_chg = ((value – baseline) /baseline )*100;
end;
run;

About

About.